


CASH FLOW & NFP
CASH FLOW & NFP

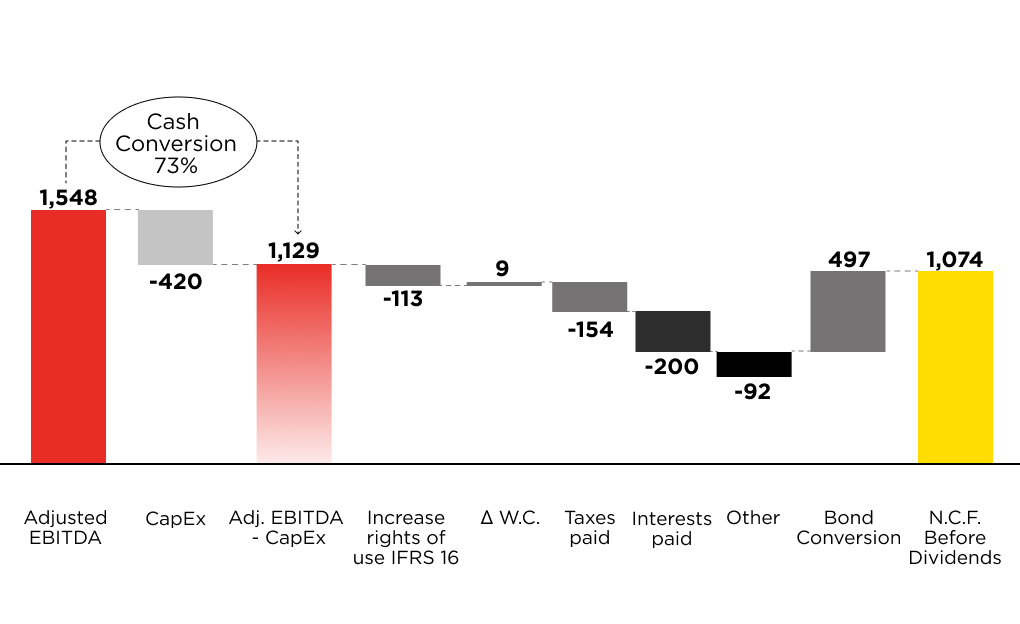
Cash Flow FY 2025
€ million
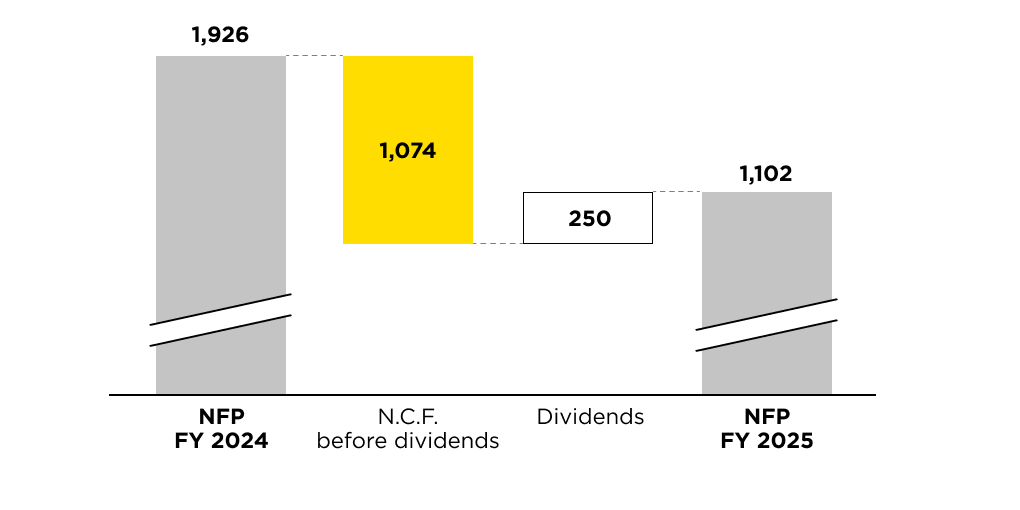
Net Financial Position Bridge FY 2024 – FY 2025
€ million
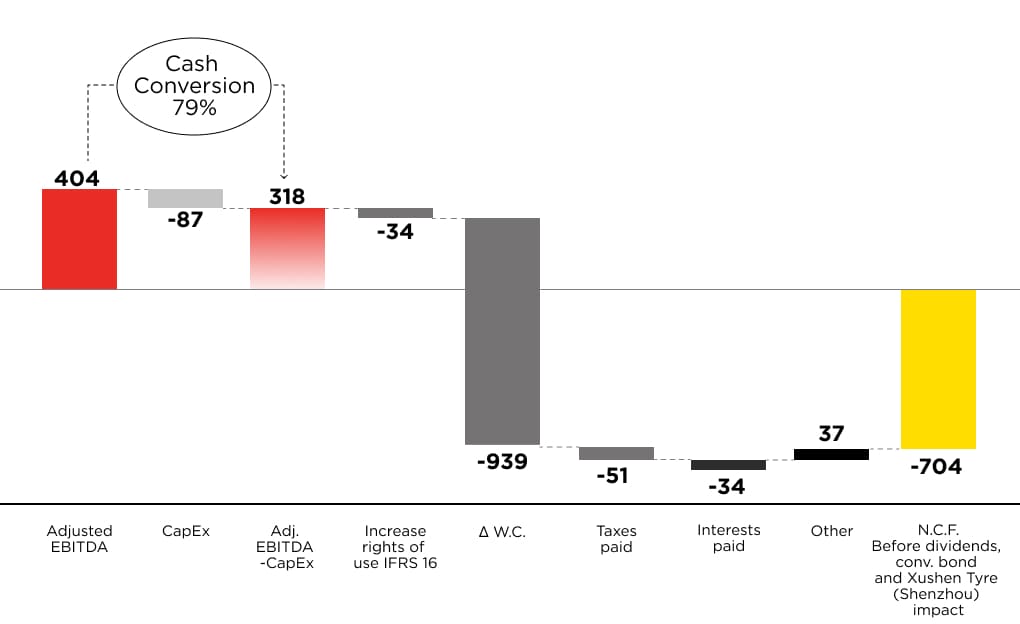
Cash Flow 1Q 2026
€ million
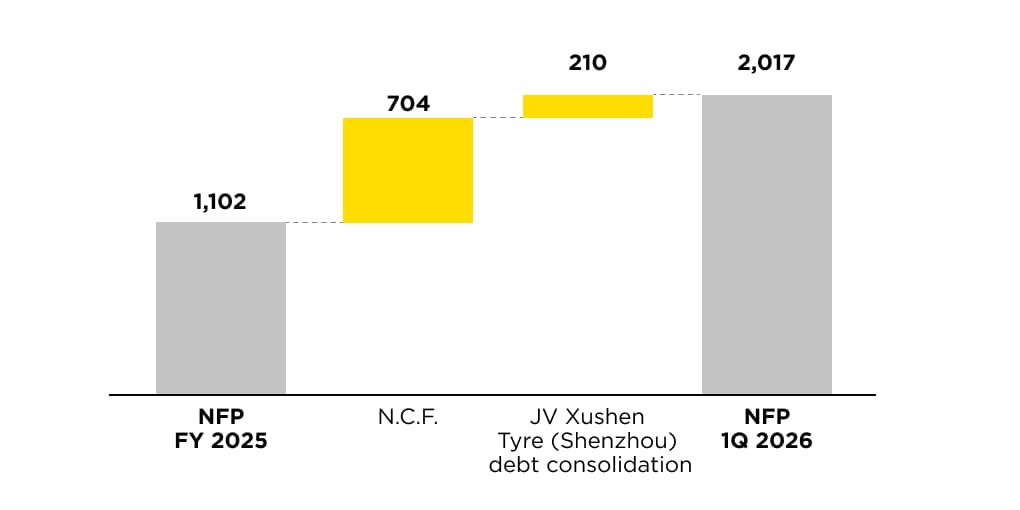
Net Financial Position Bridge FY 2025 – 1Q 2026
€ million


€ million
€ million
€ million
€ million
Further information on the company's financial communications is available in the
Do you have any questions about Pirelli tyres, services, or do you need assistance with our products?
Send your support requestOur corporate teams are available to assist with institutional and corporate enquiries. This form is not intended for customer service requests.