


FINANCIAL HIGHLIGHTS

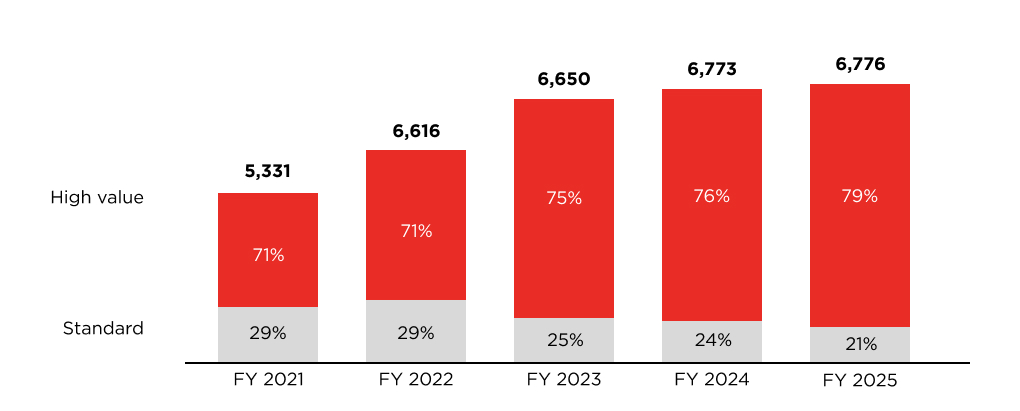
Revenues
€ million
| Revenues drivers | ∆ '21 vs. '20 |
∆ '22 vs. '21 |
∆ '23 vs. '22 |
∆ '24 vs. '23 |
∆ '25 vs. '24 |
| Volumes | +15.7% | -1.0% | -1.8% | +1.9% | +0.4% |
| Price/Mix | +9.1% | +19.7% | +8.6% | +2.5% | +3.8% |
| Foreign Exchange | -0.9% | +5.4% | -6.3% | -2.5% | -3.8% |
| Scope | - | - | - | - | -0.4% |
| Total | +23.9% | +24.1% | +0.5% | +1.9% | +0.0% |
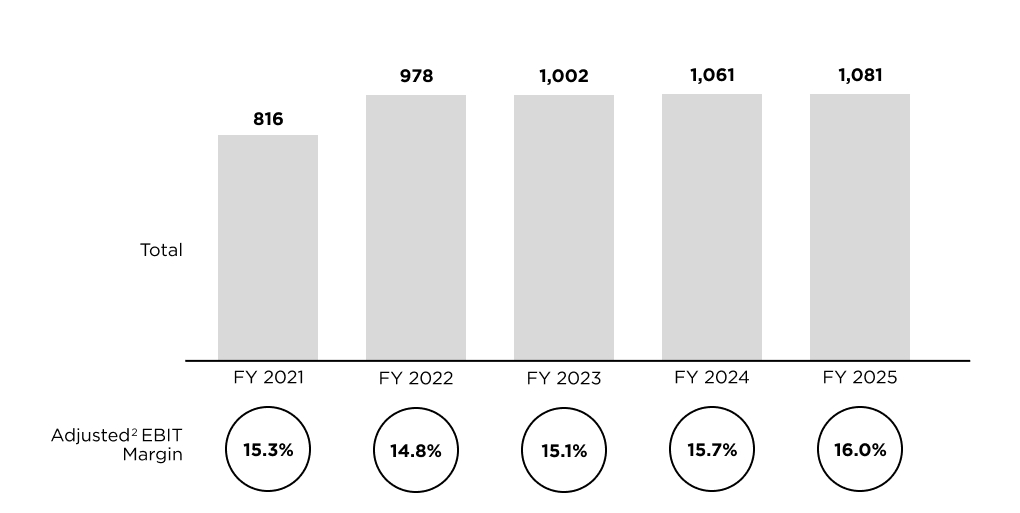
Adjusted2 EBIT
€ million
| € million | FY 2021 | FY 2022 | FY 2023 | FY 2024 | FY 2025 | ∆ '25 vs. '24 |
| Revenues | 5,331 | 6,616 | 6,650 | 6,773 | 6,776 | 0.0% |
| Of which High Value | 71% | 71% | 75% | 76% | 79% | |
| Of which Standard | 29% | 29% | 25% | 24% | 21% | |
| Adjusted1 EBITDA | 1,211 | 1,408 | 1,446 | 1,520 | 1,548 | +1.9% |
| Adjusted1 EBITDA margin | 22.7% | 21.3% | 21.7% | 22.4% | 22.8% | |
| Adjusted2 EBIT | 816 | 978 | 1,002 | 1,061 | 1,081 | +2.0% |
| Adjusted2 EBIT margin | 15.3% | 14.8% | 15.1% | 15.7% | 16.0% | |
| Net Income adjusted3 | 469 | 570 | 595 | 614 | 622 | |
| Net Income adjusted3 margin | 8.8% | 8.6% | 9.0% | 9.1% | 9.2% | |
| Adjusted1 EBITDA - CapEx | 865 | 1,011 | 1,040 | 1,105 | 1,129 | |
| Cash conversion ratio4 | 71% | 72% | 72% | 73% | 73% | |
| CapEx on Revenues | 6.5% | 6.0% | 6.1% | 6.1% | 6.2% | |
| Net Financial Position | 2,907 | 2,553 | 2,262 | 1,926 | 1,102 | |
| Research & Development costs | 240 | 264 | 289 | 290 | 313 | |
| R&D costs / Revenues | 4.5% | 4.0% | 4.3% | 4.3% | 4.6% |
- 1. Adjusted EBITDA: calculated by adjusting EBITDA for non-recurring and restructuring expenses, the contribution to the consolidated financial statements made by Pirelli Venezuela C.A. and the contribution to the consolidated financial statements made by the Steelcord activities.
- 2. Adjusted EBIT: calculating by adjusting Operating profit (EBIT) for amortization of intangible assets included in PPA, non-recurring and restructuring expenses, the contribution to the consolidated financial statements made by Pirelli Venezuela C.A. and the contribution to the consolidated financial statements made by the Steelcord activities.
- 3. Net income adjusted: calculated by adjusting Total net income (loss) for EBIT adjustments, the Venezuela deconsolidation, Net financial expenses and Tax.
- 4. Cash conversion ratio: calculated by dividing Adjusted EBITDA - CapEx by Adjusted EBITDA.
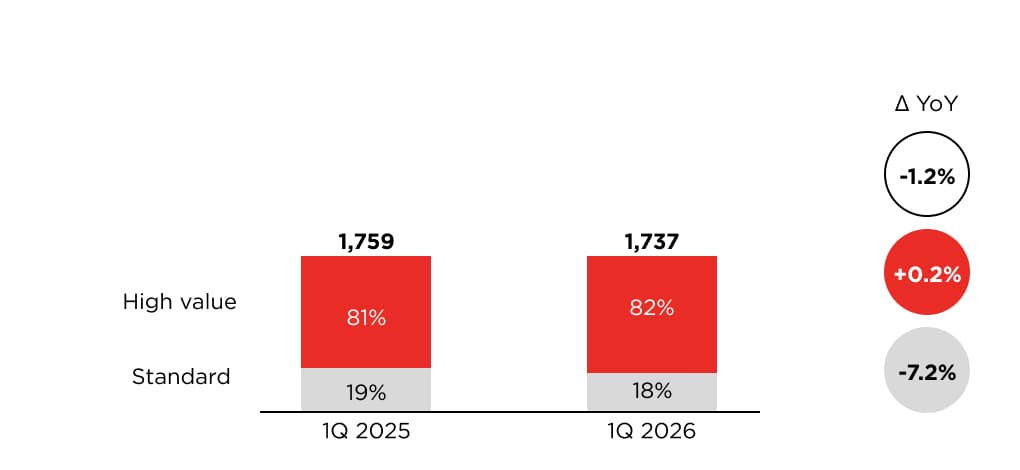
Revenues
€ million
| Revenues drivers | ∆ YoY |
| Volumes | +1.5% |
| Price/Mix | +2.0% |
| Foreign Exchange / IAS 29 Argentina | -4.5% |
| Scope | -0.2% |
| Total | -1.2% |
Adjusted2 EBIT
€ million
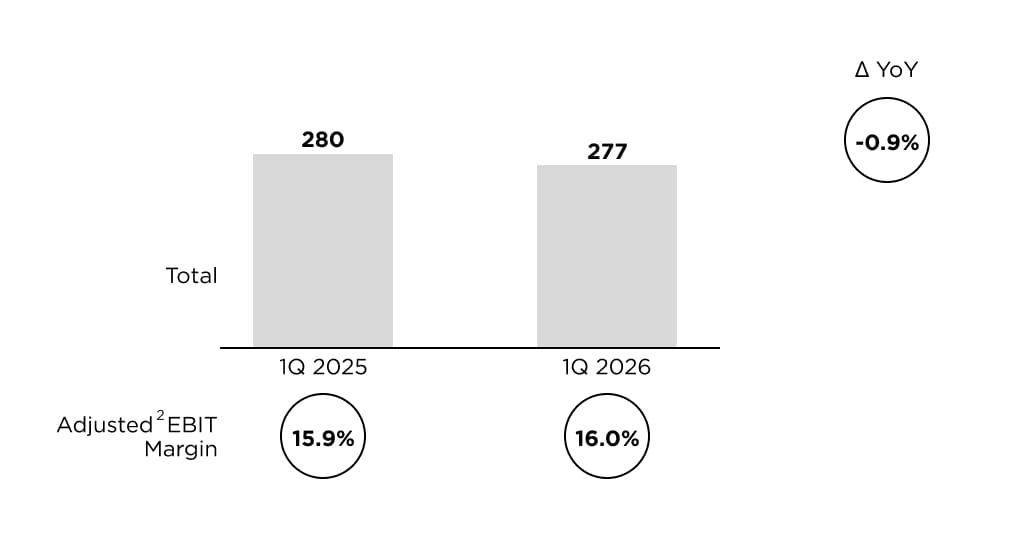
| € million | 1Q 2025 | 1Q 2026 | ∆ YoY |
| Revenues | 1,759 | 1,737 | -1.2% |
| Of which High Value | 1,424 | 1,426 | +0.2% |
| Of which Standard | 335 | 311 | -7.2% |
| Adjusted1 EBITDA | 399 | 404 | +1.4% |
| Adjusted1 EBITDA margin | 22.7% | 23.3% | |
| Adjusted2 EBIT | 280 | 277 | -0.9% |
| Adjusted2 EBIT margin | 15.9% | 16.0% | |
| Net income | 127 | 157 | +23.3% |
| Net Income margin | 7.2% | 9.0% | |
- 1. Adjusted EBITDA: calculated by adjusting EBITDA for non-recurring and restructuring expenses.
- 2. Adjusted EBIT: calculating by adjusting Operating profit (EBIT) for amortization of intangible assets included in PPA, non-recurring and restructuring expenses.