


BALANCE SHEET

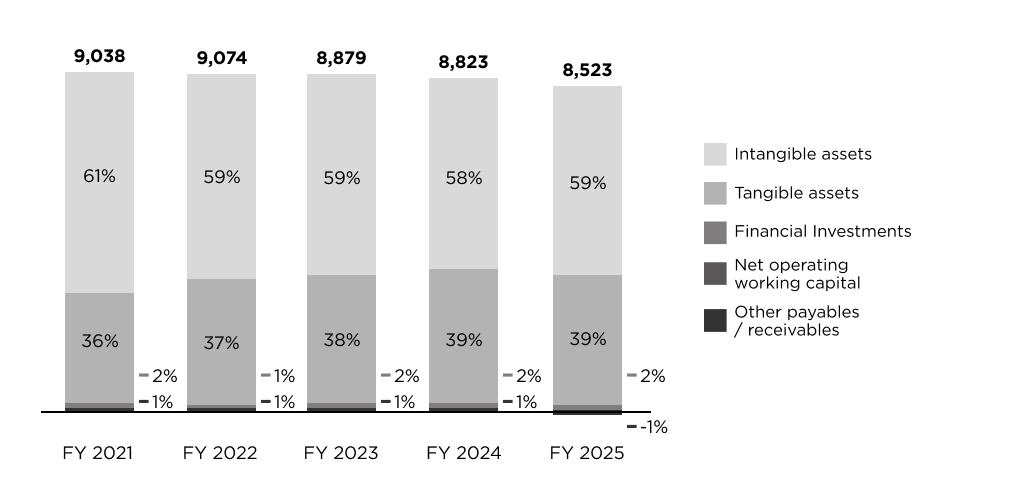
Net Invested Capital
€ million
Source of Financing
€ million
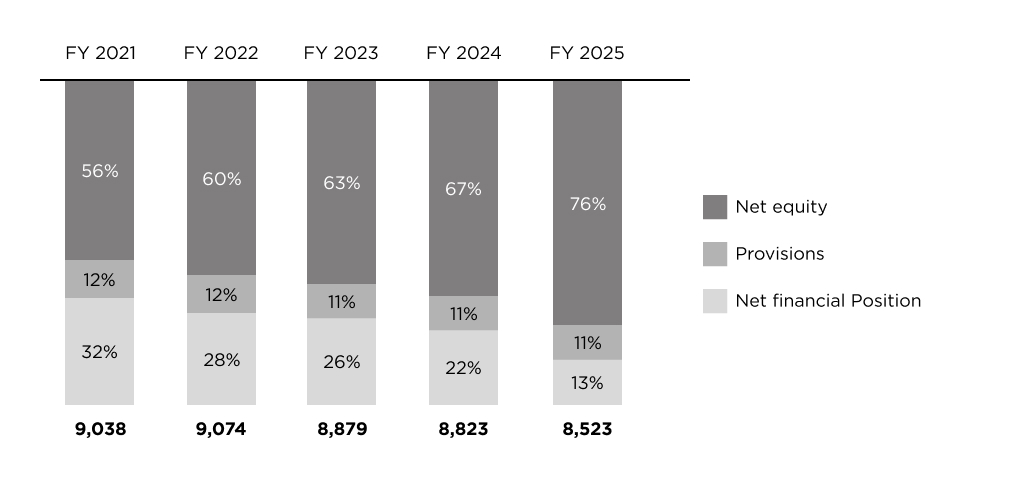
| € million |
FY 2021
|
FY 2022
|
FY 2023
|
FY 2024
|
FY 2025
|
| Intangible assets | 5,486 | 5,383 | 5,264 | 5,160 | 5,048 |
| Tangible assets | 3,289 | 3,400 | 3,409 | 3,428 | 3,366 |
| Financial Investments | 138 | 129 | 139 | 184 | 179 |
| Net operating working capital | 125 | 121 | 21 | 9 | 2 |
| Other payables / receivables | 1 | 42 | 46 | 42 | -72 |
| Net Invested Capital | 9,038 | 9,074 | 8,879 | 8,823 | 8,523 |
|---|
| Net equity | 5,043 | 5,454 | 5,620 | 5,912 | 6,457 |
| Provisions | 1,088 | 1,068 | 998 | 985 | 965 |
| Net financial position | 2,907 | 2,553 | 2,262 | 1,926 | 1,102 |
| Source of financing | 9,038 | 9,074 | 8,879 | 8,823 | 8,523 |
|---|
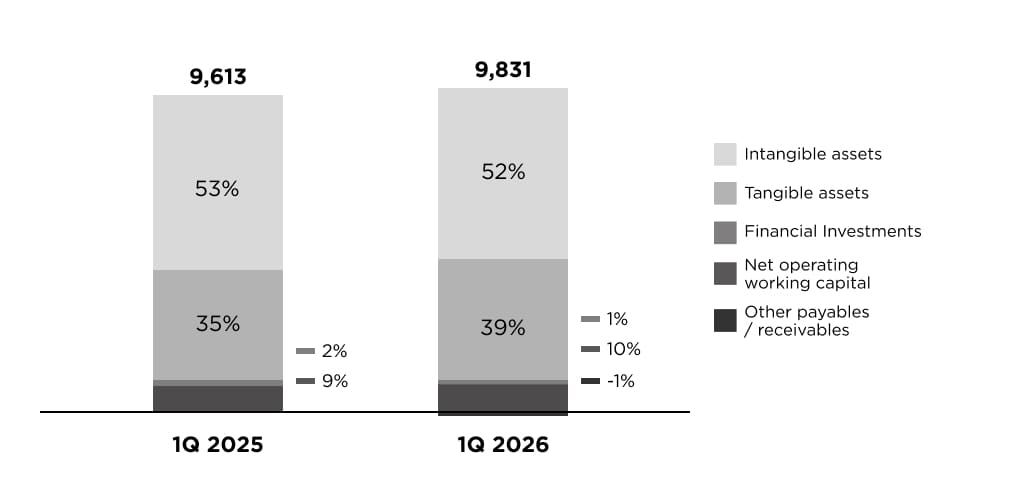
Net Invested Capital
€ million (reported figures)
Source of Financing
€ million (reported figures)
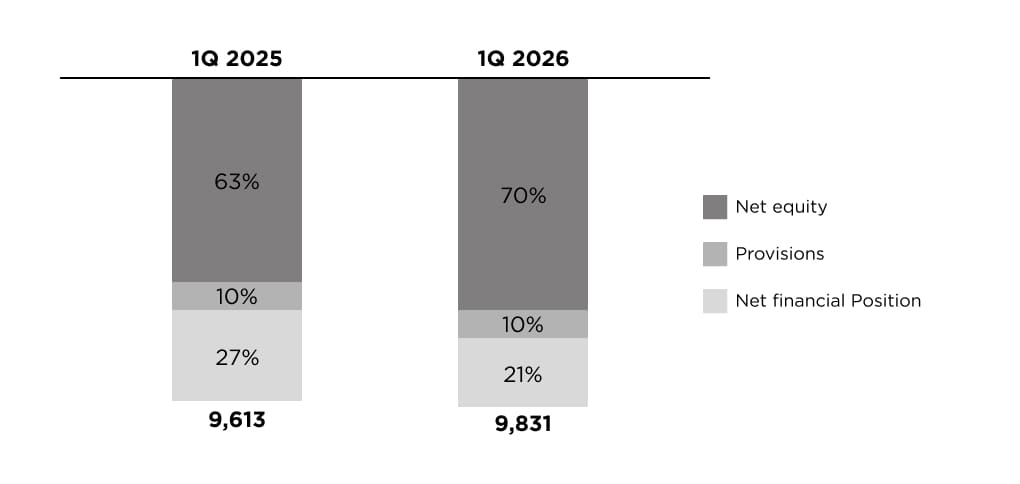
| € million (reported figures) |
1Q 2025
|
1Q 2026
|
| Intangible assets | 5,133 | 5,115 |
| Tangible assets | 3,385 | 3,823 |
| Financial Investments | 205 | 83 |
| Net operating working capital | 898 | 942 |
| Other payables / receivables | -8 | -132 |
| Net Invested Capital | 9,613 | 9,831 |
|---|
| Net equity | 6,013 | 6,859 |
| Provisions | 977 | 955 |
| Net financial position | 2,623 | 2,017 |
| Source of financing | 9,613 | 9,831 |
|---|