


Capital Structure
Capital Structure

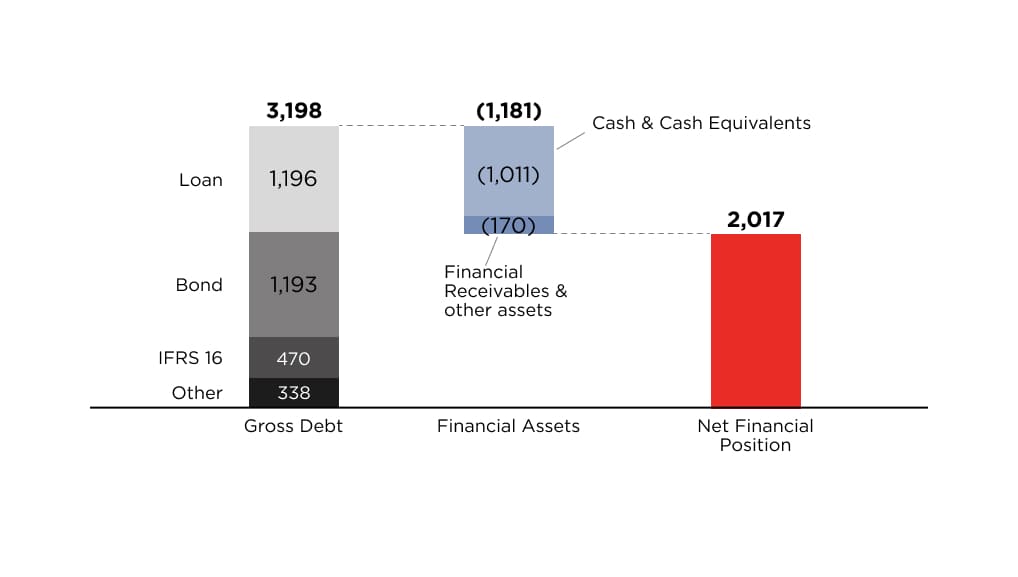
Net Financial Position
€ million
Liquidity Profile
€ million
| Liquidity position1 | 1,011 |
| Committed lines not drawn | 1,500 |
| Liquidity margin* | 2,511 |
|---|
*Sound liquidity margin covering > 3 years of debt maturity
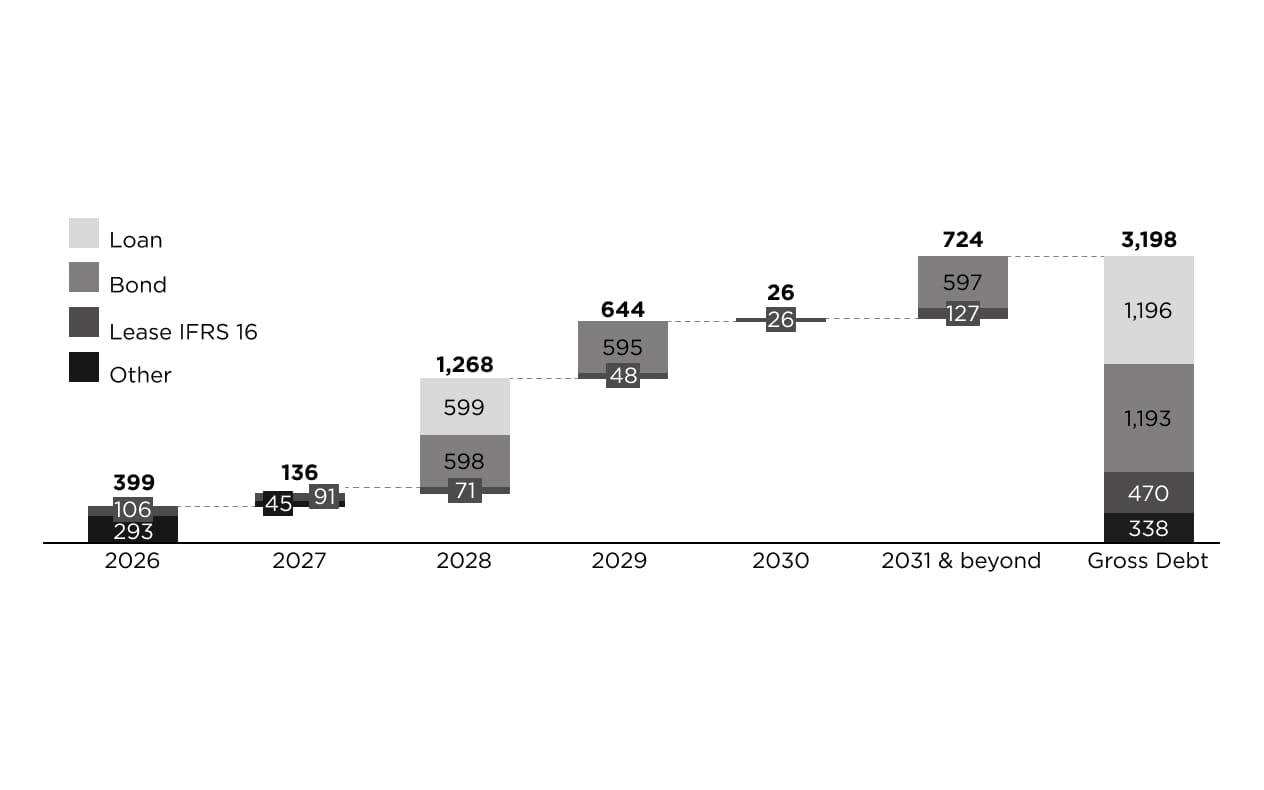
Gross Debt Maturity
€ million
Debt Currency Mix2
Share of debt
1. Including assets at FV through P&L.
2. Based on average gross debt and hedging of intragroup financing.
Net Financial Position
€ million
| Gross debt | Financial Assets | Net Financial Position | |
|---|---|---|---|
| Loan | 1,196 | Liquidity position (1,011) | |
| Bond | 1,193 | ||
| IFRS 16 | 470 | Financial receivables & other (170) | |
| Other | 338 | ||
| Total | 3,198 | (1,181) | 2,017 |
Liquidity Profile
€ million
| Liquidity position1 | 1,011 |
| Committed lines not drawn | 1,500 |
| Liquidity margin | 2,511 |
|---|
Gross Debt Maturity
€ million
| 2026 | 2027 | 2028 | 2029 | 2030 | 2031 & beyond | Total Gross Debt | |
|---|---|---|---|---|---|---|---|
| Loan | - | - | 599 | - | - | 597 | 1,196 |
| Bond | - | - | 598 | 595 | - | - | 1,193 |
| IFRS 16 | 106 | 91 | 71 | 48 | 26 | 127 | 470 |
| Other | 293 | 45 | - | - | - | - | 338 |
| Total | 399 | 136 | 1,268 | 644 | 26 | 724 | 3,198 |
Debt Currency Mix2
Share of debt
| EUR | BRL | GBP | RUB | CNY | RON | Other | Total |
|---|---|---|---|---|---|---|---|
| 84% | 5% | 3% | 1% | 1% | 3% | 3% | 100.0% |
1. Including assets at FV through P&L.
2. Based on average gross debt and hedging of intragroup financing.